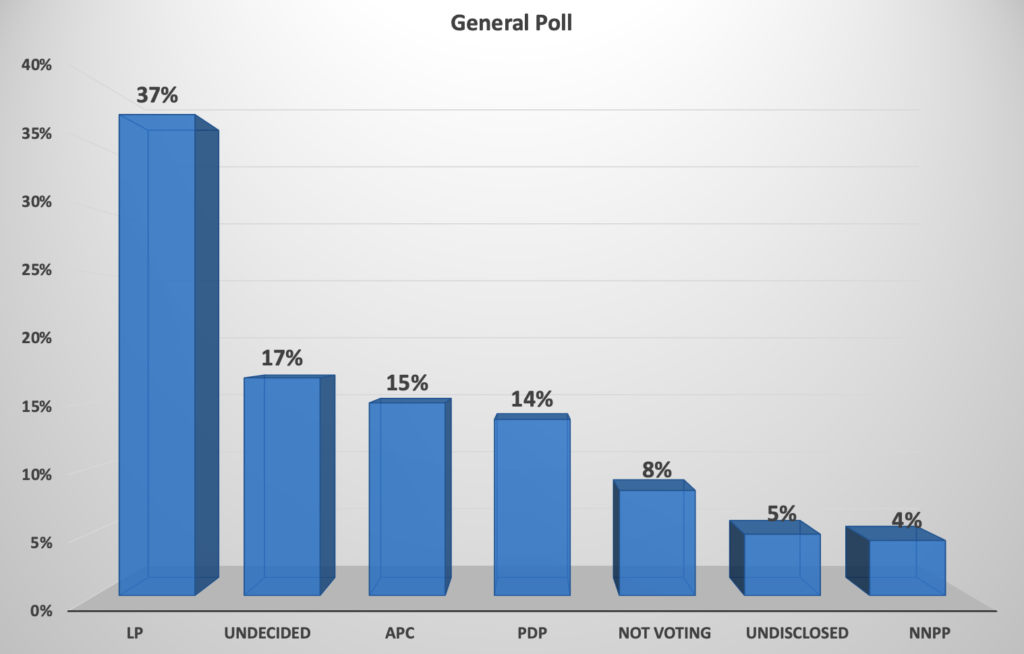
Our Polls conducted between the 27th November – 9th December 2022 across the country puts Peter Obi, the Labour Party presidential candidate ahead. Our team were despatched to all 6 geopolitical zones including Abuja (FCT), the numbers we have are telling after the arduous journey riddled with risks of kidnapping, banditry, and the lack of decent infrastructural connectivity in most rural areas, sometimes, even in urban areas.
Our team went to 3 states in the North-East (Gombe, Adamawa and Taraba), 3 in the North-West (Kaduna, Kano and Katsina), 3 states in the North-Central (Plateau, Niger and Nasarawa), 3 states in the South-East (Oyo, Ondo and Lagos), 5 states in the South-South (Delta, Edo, Cross River, Rivers and Akwa Ibom), 3 states in the South-East (Anambra, Imo and Enugu) and Abuja (FCT).
We selected 3 states from each geopolitical zone for our polls, normally, not more than 10 respondents in each community or local government with the exemption of Lagos and Kano where the population numbers are quite high. Unlike other polls conducted, 95% of our respondents were recorded (all recordings are available), whilst 5% were voice recordings of polled individuals who didn’t wish to be captured on video recording. In our January polls, we will cover the remaining 3 states in each geopolitical zone that we did not poll during our December polls, whilst we intend to capture the entire country in one fell swoop in our penultimate polling in February.
Our polls are the most comprehensive and detailed ever carried out in Nigeria. Our results are peer reviewed for rigour and robustness, and our sampling ensured that any chance of inadvertent bias was eliminated. It is important to mention that none of our pollster is of the South-eastern extraction.
Our polls are broken into different layers, to give us deeper insight into the Nigerian demography. We use these layers to distinguish other variables in respondent’s inclination, thus gaining further insights into other narratives which we will be sharing on our website and social media handles including YouTube. Some of the categories we used were:
- Religion
- Gender
- Age (Gen Z, Millennial, Gen X and Baby Boomer)
- Ethnicity
- Marital Status
- Employment Status
- Educational Background
- Reason for voting
- And finally, is there anything the other candidates can do to change your mind.
Using this format, we extrapolated great insight into the respondent’s inclination, root out certain biases and strengthened our conclusion when these data were interrogated. As they say, “data don’t lie, and unbiased data is the closest thing to the truth” what we have here is the latter.
We believe our polls and data we have on file are the best anyone has ever come close to; we can share these upon request to reputable organisations should further peer reviewing be required. There is no better way to understand what Nigerian think than approaching them physically at their homes, workplaces, social public gatherings and whilst going by their everyday lives, that’s exactly what we did. We have a policy of no persuasions, no interrogation, no bias but just a simplified conversation in a dialogue format, i.e., the respondents feed us their position, we simply take them in.
Our carefully selected categories will reveal if the respondents have inconsistencies, these we will share on our social media accounts, follow us for everything #2023Election. Our numbers across the country showed higher level of undecided, undisclosed and not voting respondents respectively. It can be argued that for fear of some sort, many chose not to reveal who they intend to vote on camera given the fragility of our democracy, but the reality stays unchanged, there are still many minds to sway either way, the candidates should take this into account.
Below is our general poll of Nigeria:
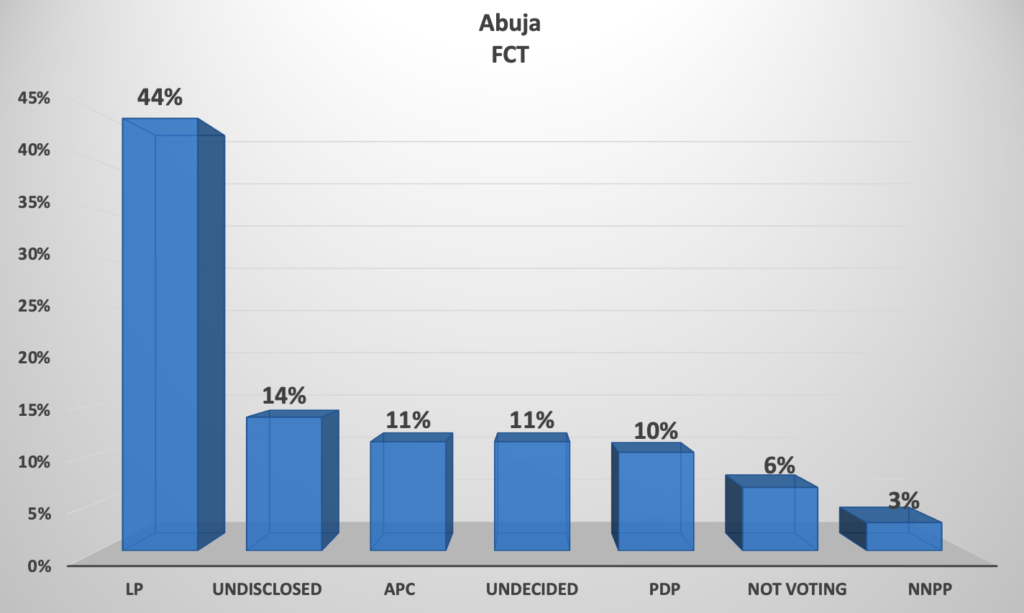
FCT:
In the FCT, we covered the following areas: Garki Area 1, Asokoro, Wuse Zone 5, Gudu, Bwari Area Council, Gwagwalada Area Council Zuba, Gwagwalada Area Council Tunga Maje, Gwagwalada Area Council, University of Abuja, Gwagwalada Area Council Giri, Kuje Area Council Kuje Ibi, Kuje Area Council Kuje Market, Kuje Ako, Kuje Area Council Kuje Guduaba, Garki Area 2, Garki Area 10, Garki Area 3, Wuse 2 and Jabi.
We made sure our numbers per area were limited and spread across the landscape of Abuja so we can get a clearer representation. 60% of Abuja’s respondents were Christians whilst 27% were Muslims and non-affiliation rounded the number at 13%.
78% were male whilst 22% female, regarding age, we split our respondents by Gen Z (1997-2012), Millennial (1981-1996), Gen X (1965-1980) and Baby Boomer (1946-1964), of these, 21% were Gen Z, 53% Millennial, 22% Gen X and 4% Baby Boomer.
41 ethnic groups were represented in the FCT polls.
20% were student, 47% self-employed, 4% unemployed and 28% employed, however, it is important to point out that not everyone is comfortable giving their age, so just 57% of respondents gave their age.
What’s also interesting here is that ethnicity and religion, Nigeria’s two famous dilemmas had little impact on respondents voting intention. Only 1% said religion was their motivator, 2% for ethnicity, 1% for party affiliation, 7% for change, 8% for age, and a staggering 43% for capacity and trust.
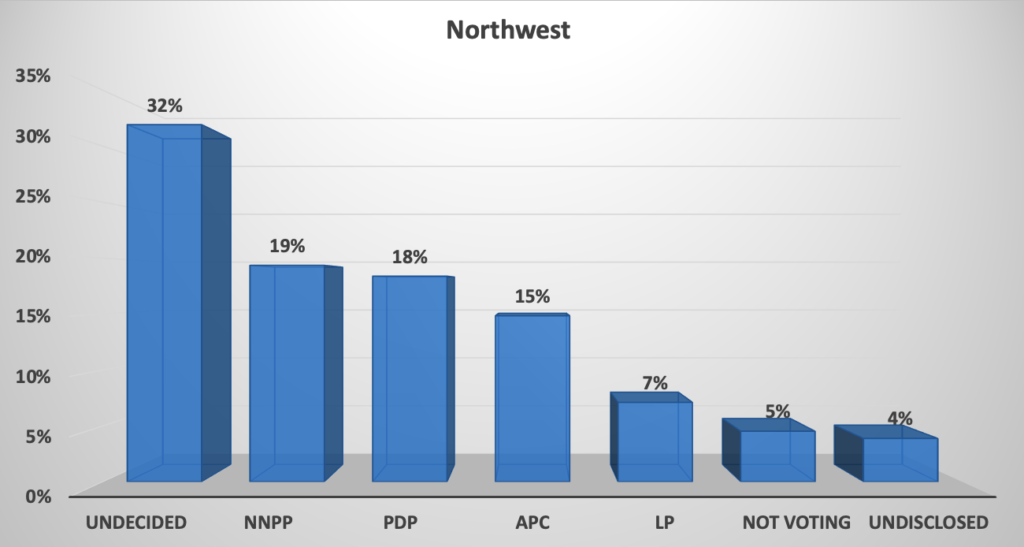
North-west
In the Northwest, we covered the following areas:
Kano (Fage, Kano Municipal, Gwari, Mungibe, Dala, Kruna, Dawano, Kankana, Sanyawa, Dankabr and Bichi).
Katsina (Katsina, Sohon Sacha, Batagarawa, Sabon Gari Alaji Yahuza, Batsari, Rimi, Abukuru and Quado)
Kaduna (Kawo, Mando, Rigasa, Tudun Wada, Central Market, Kaduna State University, Malale, Kakure, Banawa and Naraye)
Again, we made sure our numbers per area were limited and spread across the landscape of These cities/states so we can get a clearer representation. 12% of the Northwest’s respondents were Christians whilst 88% were Muslims.
12 ethnic groups were represented in NW polls.
There was overwhelming response from male in the Northwest, 93% respondents were male and just 7% were female. Another interesting factor here is on the respondent’s educational background, 43% secondary school, 29% tertiary, 9% tie for both primary and uneducated.
On age group, again, we split our respondents by Gen Z (1997-2012), Millennial (1981-1996), Gen X (1965-1980) and Baby Boomer (1946-1964), of these, 28% were Gen Z, 46% Millennial, 17% Gen X and 5% Baby Boomer.
71% are self-employed, 21% employed, 10% student, Unemployed stands at 2% and retired at 1%. Only 56% of respondents gave their reason for leaning toward their candidate, of those 83% said they their reason was based on capacity and trust, 10% for party affiliation, 5% for change, 2% ethnicity and %1 religion.
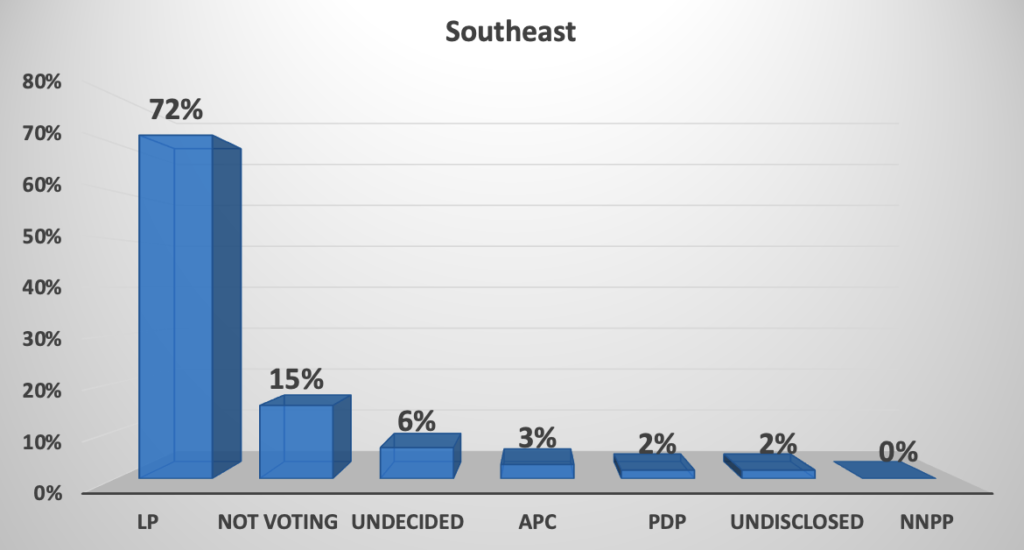
South-East
In the South East region, we covered the following areas:
Anambra (Nnewi North, Nnewi Bank Road, Ochanja Market, Nnamdi Azikiwe University, Awka)
Imo (General Hospital Umuguma, Douglas Road Owerri Municipal, Hospital Junction, World Bank Owerri West, Umuguma Market)
Enugu (Gariki, Holy Ghost, Agbani North, Kenyatta, New Market)
Our numbers were evenly spread across these communities/cities/states for an impactful representation. 74% of our respondents disclosed their religions, of these, 88% were Christians whilst 12% were Muslims.
There was overwhelming response from males in the South-East region, 83% respondents were male and 17% were female. 20 different ethnic groups from across Nigeria were represented in this region with 81% of respondents belonging to the Igbo ethnicity.
Age Group: 31% were Gen Z, 43% Millennial, 20% Gen X and 6% Baby Boomer.
91% of our respondents disclosed their employment status, out of these, 7% were students, 62% self-employed, 2% unemployed, 28% employed and 1% retired.
What’s also interesting here is that ethnicity and religion, Nigeria’s two famous political influences had little impact on respondents voting intention. 72% of our respondents gave a reason they were voting for their preferred candidate. Out of these respondents none stated religion as their motivator, 7% for ethnicity, 1% for party affiliation, 6% for change, 7% for age, and a staggering 79% for capacity and trust.
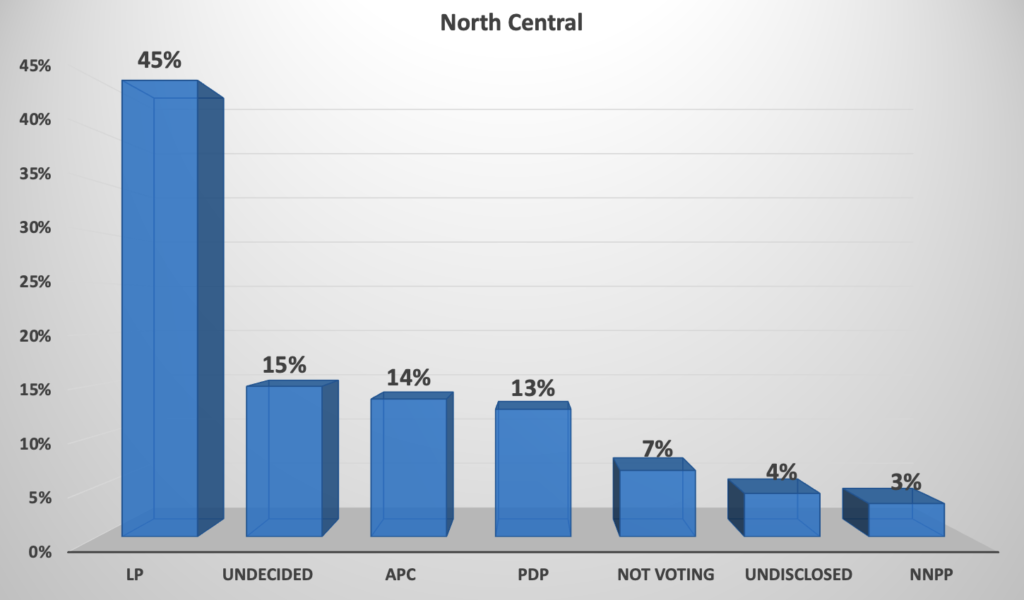
North-Central
In the North-Central region, we covered the following areas:
Jos (Jos North Terminal Bus Stop, Mai Adiko, Satellite Market, Kabong, Challang, Bassa, Zarazong, Kerker and Riyom).
Nasarawa (College of Education Akwanga, Dan Dabi, Angwan Lambu, Jigwada, Masaka, Ado and Mararaba)
Niger (Lambata, Suleja, Kwata, Abdulsalam Abubakar Garage, Tunga Market, Madalla, Bassa, Gwari Market, Bomas, Central Market, Kpakungu, Mandela Street)
Again, we made sure our numbers per area were limited and spread across the landscape of these communities/cities/states for an impactful representation. 61% of the North-Central’s respondents were Christians whilst 39% were Muslims.
There was overwhelming response from males in the North-Central region, 71% respondents were male and 29% were female. 53 different ethnic groups from across Nigeria were represented in this region.
Age Group: 92% of our respondents disclosed their ages. Out of these, 23% were Gen Z, 52% Millennial, 21% Gen X and 4% Baby Boomer.
87% of our respondents disclosed their employment status, out of these respondents, 9% were students, 56% self-employed, 2% unemployed, 32% employed and 1% retired.
Again, ethnicity and religion, had little impact on respondents voting intention. 66% of our respondents gave a reason they were voting for their preferred candidate. Out of these respondents Only 2% stated religion as their motivator, 2% for ethnicity, 5% for party affiliation, 16% for change, 7% for age, and a staggering 68% for capacity and trust.
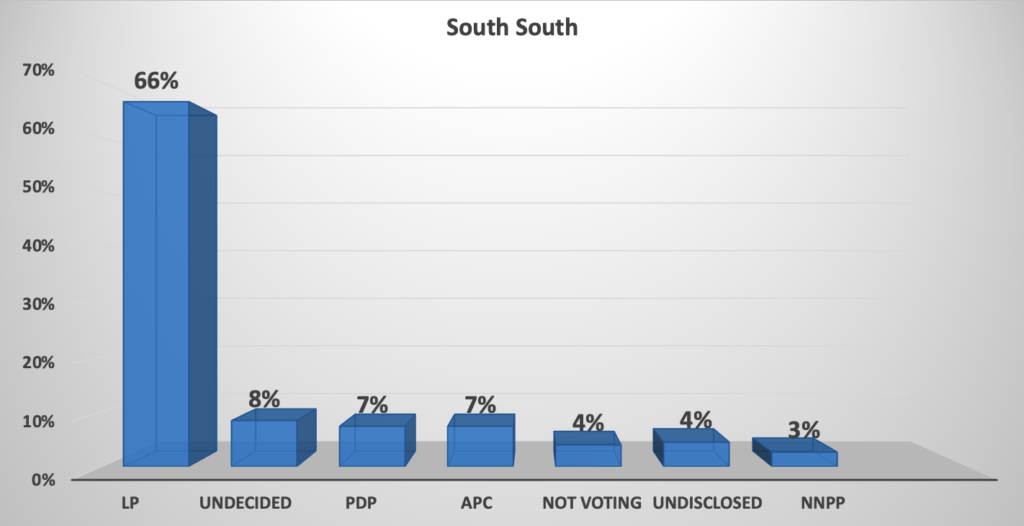
South-South
In the South-South we covered the following areas:
Akwa-ibom (Itam, Itu, Ibiono, Mpat Enin, Etim Ekpo, Etinan).
Cross River (Calabar).
Delta (Ifa Jesus Market, Asaba Stephen Kechi Stadium, Dennis Osadebe University, General Hospital, Midwifery Market, Asaba Obilo, Ogbosue Community).
Rivers (Rumukurushi, Obio Akpor, Mile 1 Market, Rumuomasi, Borokiri Aba Road, Artillery).
Edo (Igo, University of Benin, Eweka, Benin city, Boka Awka, Iworde).
our numbers per area were limited and spread across the landscape of these communities/cities/states for an impactful representation. 84% of the South-South respondents were Christians whilst 9% were Muslims and non-affiliation rounded the number at 8%.
There was overwhelming response from male in the South-South as was the patter throughout the zones we’ve covered, 84% respondents were male and just 16% were female. Another interesting factor here is on the respondent’s educational background which only 29% disclosed their level of education, 47% secondary school, 44% tertiary, 10% tie for both primary and uneducated.
Age Group: 92% of our respondent disclosed their age, of these, 22% were Gen Z, 50% Millennial, 25% Gen X and 3% Baby Boomer.
Again only 78% of our respondent disclosed their employment status of which 72% were self-employed, 19% employed, 7% student and unemployed stands at 2%. Only 79% of respondents gave their reason for leaning toward their candidate, of those 74% said they their reason was based on capacity and trust, 2% for party affiliation, 11% for change, 5% for age, 5% ethnicity and 2% religion.
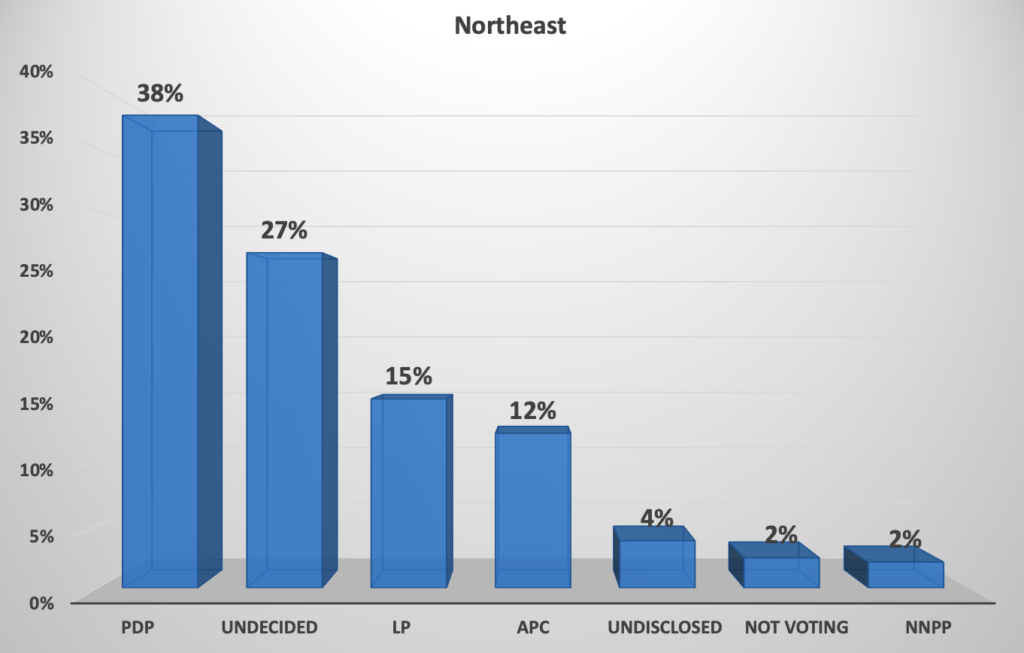
North-East:
In the Northeast, we covered the following areas:
Adamawa (Bature, Wurebajee,Boronji, Jimeta, Bakin Kogi, Wulere, Mayo belwa)
Taraba (Magwa, Machiri, Sabon Gari, Sabon Kasuwa, Bantinabu, Langabiri, Taraba State University, Aruta, Taraba State Polytechnic, Ardo Kola, Arbakula, Lau).
Gombe (Gombe)
Our numbers per area were limited and spread across the landscape of these communities/cities/states for an impactful representation. 32% of the Northwest’s respondents were Christians whilst 67% were Muslims and non-affiliation rounded the number at 1%.
25 ethnic groups were represented in the NE polls.
95% were male whilst 5% female, regarding age, 97% of our respondent disclosed their age and we split them by Gen Z (1997-2012), Millennial (1981-1996), Gen X (1965-1980) and Baby Boomer (1946-1964), of these, 34% were Gen Z, 45% Millennial, 19% Gen X and 3% Baby Boomer.
Again only 64% of our respondent disclosed their employment status and of which 66% are self-employed, 6% employed, 25% student and Unemployed stands at 4%. Only 62% of respondents gave their reason for leaning toward their candidate, of those 72% said they their reason was based on capacity and trust, 12% Affiliation, 4% for change,11% ethnicity and 1% religion.
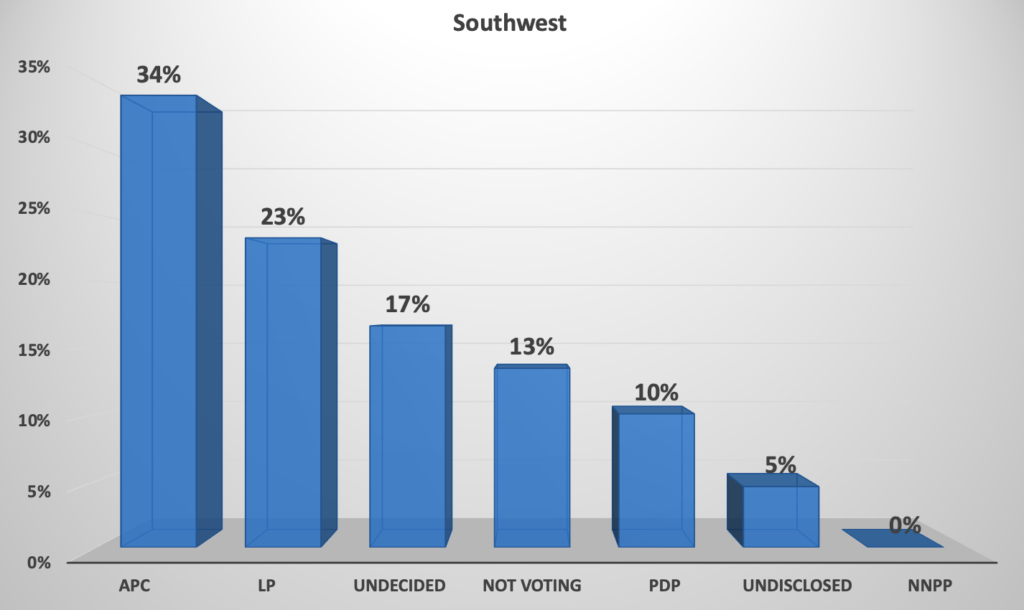
South-West
In the South West region, we covered the following areas:
Lagos (Oshodi, Mushin, Yaba, Costain, Ikorodu, Ojota, Ajah, Lekki, Itedu Market, CMS, Obalende and Badore)
Oyo (Akobo Ojurin, Gate Ibadan, Olodo Road, Challenge Ibadan, Dugbe, Molete)
Ondo (Oja Oshodi Akure, Post office Akure, Army Barracks Akure, Old Garage Akure)
Our numbers per area were limited and spread across the landscape of these communities/cities/states for an impactful representation. 61% of our respondents were Christians whilst 39% were Muslims.
There was overwhelming response from males in the South-West region, 76% respondents were male and 24% were female. 15 different ethnic groups from across Nigeria were represented in this region with 67% of respondents belonging to the Yoruba ethnicity.
Age Group: 11% were Gen Z, 47% Millennial, 36% Gen X and 6% Baby Boomer.
On respondent employment status,2% were students, 73% self-employed, 2% unemployed and 23% employed.
Nigeria’s two famous political influences, ethnicity and religion had little impact on respondents voting intention. 59% of our respondents gave a reason they were voting for their preferred candidate. Out of these respondents none stated religion as their motivator, 21% for ethnicity, 5% for party affiliation, 6% for change, and a staggering 68% for capacity and trust.


There are a few problems with your poll. You made a claim that your work represented the most detailed work done on the election so far. There are 2 problems with that claim. The first is that it is highly unprofessional and unethical to make such claim.
The second problem is that the claim is flat out wrong. For one, there is absolutely nothing scientific about your poll. In a country with registered voters for both sexes at almost 50% each, you didn’t weight for sex? You didn’t properly weight for population also to reflect the exact proportion of registered voters per state.
The biggest problem of all is that you released a the videos of some of your interviewees showing their faces and voices. What were you thinking? Do you know that could open you up to legal liabilities?
And then there is the problems of the headlines you choose which are provocative and sensationalizes your result. No serious pollster goes out of their to sensationalize their own result. A proper pollster collects their data, analyze them, then releases them to the public to form whatever opinion on it.
There are a lot more issues but let me stop here. You guys need to fix up
If you’ve taking out time to read thru all the facts they presented, then you won’t be saying what u just said. Every poll makes use of the standard 400/1000 random sample no matter the population. They actually went over board to use 2,000 & 3,000 sample size in all the regions, physical survey (they didn’t need to). Ironically the result didn’t change much. Obi still won. They weighted for age, sex, religion etc. They used all the parameters and went overboard to do video and audio recording to show evidence. Here you are being dismissive of the whole effort. Ironically their outcome and Anap poll is basically the same. I think they did a good job. Infact the confidence level in their poll is abt +/-3% . That’s high confidence level.
Spot on
Who you are supporting has clouded you sense of reasoning
Cry me a river …agbado and mikano agent sighted 🤣
Cry me a river …agbado and mikano agent sighted 🤣
Cry cry babies
I pray to almighty God to be so because will Nigeria need a better change will must move forward
Your polls seem logical but your analysis is biased. Stop trying to use psyche in your other analysis to make it look like Obi is losing when it’s obvious he’s ahead.
This is the problem. Obi is ahead in SE/SS/NC. Obi is a close second in SW and second to Atiku in the NE. Why does he make it look like Obi is losing when Obi is clearly ahead. Statements like Obi obliterated in the NW comes to mind. Come on wake up. Obi is leading in the popular vote and is on course to get 25% in all states in 4 regions namely SS/SE/NC and SW. Obi has won the election if it’s free and fair. And now Obi has taken his campaign in the north. The NW is buying into his campaign, you see the turnouts in Kano and katsina. This election will be decided on first ballot. Stop playing.
Your polls seem logical but your analysis is biased. Stop trying to use psyche in your other analysis to make it look like Obi is losing when it’s obvious he’s ahead according to your polls.
Brilliant and most detailed physical poll, I have ever seen with the highest sample size so far!. CF commendable. Well-done. Looking forward to the next 3 states per zone and the ultimate poll before February 2023. However, I think next time for a state like Ondo, your sample size shouldn’t have been limited to Akure, but other towns.
Also record the consent respondents give you for consent, so as to be safe.
Welldone!
Great work but please how’s the Labour Party ahead of the APC in the Northeast?
Tinubu has been spending money for campaigns and rallies that he should’ve left for his children’s children. The LP is ahead because of the youths and students. The suffering is too much, do you expect Nigerian youths to vote APC back in power after this nightmare they’ve been through in 8 years? You can see the body language, the North is not in support of Tinubu. Atiku is the second most favorite politician after buhari in the north. Tinubu made a mistake by banking on northern votes and it cost him the southern votes as well. It will be clearer in a matter of weeks.